Stavros Tombazos, Associate Professor, Department of Social and Political Sciences, University of Cyprus
tombazos@ucy.ac.cy
Abstract
The Cyprus’s model of accumulation was not only structurally unbalanced but also very sensitive to developments abroad, especially after the accession in the EU and the adoption of the euro. The economic crisis in Cyprus is closely related to the deep and prolonged recession in Greece. In the general contest of the European slowdown of growth rate, the Cypriot ‘hypertrophic’ banking system, expanded on the international level in recent years, couldn’t absorb the double choc of the increase of its non-performing loans in Greece and the ‘haircut’ of Greek sovereign debt. However, the memorandum imposed on Cyprus led to a vicious circle, where the recession of the ‘real economy’ fuels the banking crisis and vice versa. Beside the decrease of wages, the austerity policies didn’t result to an increase of Cyprus’s price-competitiveness, but to the rise of the exploitation rate of labour force. Under these circumstances, an exit of the structural crisis is not in sight.
During the last decades there was a remarkable economic growth in Cyprus, albeit based on a model of capitalist accumulation with an expiration date: The growth model which prevailed was the source of considerable social inequalities, ecologically problematic, structurally unbalanced and, as proved now by reality, especially sensitive to developments in other economies. We shall review it giving emphasis on the most recent period before the crisis.
The ‘Achilles heel’ of this model of development was the ‘hypertrophic’ banking sector, which had extended unreasonably in the international market, and resulted in Cyprus not being able to withstand the prolonged consequences of the Greek crisis. The latter dragged Cyprus, mainly through the collapse of the Cypriot banks, into the biggest crisis after the Turkish invasion in 1974.
The banking crisis soon turned into a crisis of public debt, inaugurating thus the era of the Memorandum.
The management of the crisis by the Cypriot government and the Troika led the country into recession without solving the banking crisis.
1. The Cypriot model of development and the accession of Cyprus to the EU
The economy of Cyprus is an economy of services. The latter represent 81% of gross added value, at the same time industry, construction and agriculture represent just 9%, 8% and 2% respectively (Chart 1).

The Cypriot economy is a very open economy importing mainly goods and exporting services (Chart 2). In 2011, services to businesses accounted for 31% of export revenues. These are services to ‘offshore’ companies, which have now been renamed as ‘foreign’ companies. The latter settled in Cyprus after the destruction of Lebanon in the 1970s.
Taxation policy in Cyprus has been and continues to be particularly favourable for those businesses. Corporate tax rate increased from 10% to 12.5% due to the Memorandum imposed on Cyprus, but still remains the lowest in the euro area. Only in Ireland, the corporate tax is also 12.5%.
Since the accession of Cyprus to the EU in 2004, until the global crisis, the balance of trade in Cyprus presented a growing deficit. The latter rose from 1.2% of GDP in 2003 to 11.1% in 2008[1]. Since then, however, the trade balance shows a significant improvement. As shown in Chart 3, in 2013 it turned into a surplus. Of course, this positive development was mainly due to the contraction of imports, which is the reality in other southern European countries too.

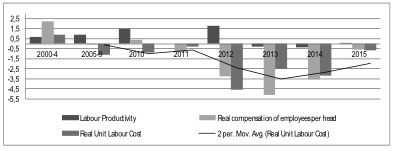
As in other countries of southern Europe[2], the upward trend in trade deficit in Cyprus before the global crisis is not due to an ‘autonomous’ increase in salaries. Since the accession of Cyprus to the EU, labour productivity had been increasing faster than real wages, a fact that was reflected in a reduction of the real unit labour cost (Chart 4).

During the period between the accession of Cyprus to the EU and the global crisis (2004-2008) there was a significant increase in imports, much more significant than in exports. The rise of the euro exchange rate played a key role in the price competitiveness of Cypriot products. Despite the fact that Cyprus adopted the euro in 2008, the exchange rate of the Cypriot pound against the dollar and other national currencies fluctuated along with the euro exchange rate: The Central Bank of Cyprus had a policy of absolute parity of the Cyprus pound with the euro.
During the 2000s, the price of Cypriot exports to 36 developed countries, expressed in dollars, increased significantly: 15% between 2001 and 2009. It declined, however, with the fall of the euro exchange rate during the period 2010-2012, by 7.5%[3]. As with other countries of Southern Europe, Cyprus’ deeper cause for the reduced price competitiveness of exports and the growth of trade deficit that followed is the German wage policy. Stagnation of real wages in Germany during the 2000s, which resulted in the increase of its trade surpluses, led to the appreciation of the euro[4].
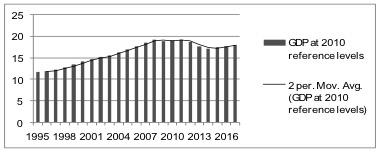
During the 2000s until the downturn of 2009, real GDP growth in Cyprus was considerable, especially between 2004 and 2008 (Chart 5). The GDP in 2008 was bigger than in 2003 by 23.5%.
During this period, private consumption and construction contributed decisively to GDP growth. Between 2000 and 2008, gross fixed capital formation in residential construction almost doubled. It increased from 0.7 billion in 2000 to 1.3 billion in 2008[5]. Today, much of the housing built during this period, particularly in tourist areas, remains vacant because of reduced internal and external demand. And of course, the big construction companies are unable to service their debts to local banks.
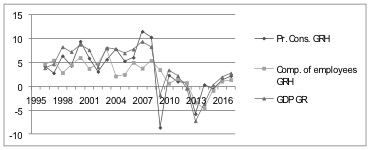
Since 2004, private consumption grew more rapidly than average wages. Of course, the gap created between the two, decreased significantly during the recession of 2009 and continued to decline until today (Chart 6).
The economic growth of the 2000s, especially after joining the EU, was based on shaky foundations: a building industry highly sensitive to fluctuations in the foreign market and on private consumption growth, which deviated considerably from growth on wages.
The accession to the EU, the linking of the Cyprus pound to the euro and the prospect of euro adoption, made the growing trade deficit less threatening. The ‘markets’ supplied the banking system with ample liquidity, thus creating a hypertrophic banking system, a credit ‘bubble’ and highly risky banking investments.
As shown in Table 1, total deposits in commercial banks and cooperative institutions continued to rise even during the first years of the global crisis (2008-2011). At an early stage, 2010-2011, Cyprus seemed to benefit from the Greek crisis through the transfer of deposits from Greece to Cyprus. This fact is confirmed by the increase in deposits in the category of ‘other euro area residents’.
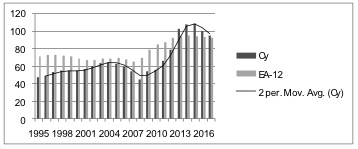
As in the case of Spain and, even more, in the case of Ireland (unlike the case of Greece), sovereign debt in Cyprus had never been particularly high compared with the average debt in the euro area. In 2009 and 2010, the public debt of Cyprus still ranged under 60% of GDP, while in the euro area it was 79.2% in 2009 and 85.9% in 2010 (Chart 7).
2. Cypriot banks, recession in Greece and Cyprus Memorandum
The real ‘Achilles heel’ of the economy of Cyprus was its banking system, particularly because of its large exposure to the risks of the deep and prolonged recession in Greece.
The assets of the Cypriot banking system, including the branches of the Cypriot banks abroad, and the subsidiaries of foreign banks in Cyprus, approached 900% of GDP in 2010. By comparison, the corresponding figure in the euro area was limited to less than 350% of GDP in 2009. Even if the activities of the Cypriot banks abroad were not taken into consideration, the assets of the banking system in Cyprus would still be seven times greater than the GDP. [6]
The percentage of non-performing loans increased rapidly in 2011, in particular through the branches of Cypriot banks in Greece. In the third quarter of 2012, the percentage of non-performing loans in Greece rose to 17.3% for the Bank of Cyprus and to 32% for the Popular Bank.
In addition, the restructuring of the Greek public debt through ‘the contribution of the private sector’ (Private Sector Involvement: PSI) cost the Cypriot banks about 4.5 billion in 2012, equivalent to 25% of the Cyprus GDP (18.7 billion in 2012). Amid the global crisis, the Cypriot banks were engaging in speculative investments by buying securities of billion of Euros related to Greek public debt in the secondary market (mainly from German banks).
These developments led to a significant reduction of the index core tier one. At the Bank of Cyprus this index decreased to 5.1% in the second quarter of 2012 from 8.1% in 2010. In July 2012, the state had to recapitalize the Popular Bank with 1.8 billion. Its index core tier one fell to 4.4% in the second quarter of 2012 while a 9% is required.
Also, in 2011, the profitability of the Cypriot banks, which had been decreasing from the beginning of the global crisis, turns to negative, while the market value of bank shares vanished.[7]
The banking crisis quickly turned into a sovereign debt crisis, not only because the state decided to recapitalize the banking system but also because financing the public deficit through the markets had already become increasingly difficult and expensive, despite the fact that the Cyprus debt remained lower than the EU average. The successive downgrades of the Cypriot banks and the state itself by the international rating agencies discouraged the markets to lend the state of Cyprus.
The necessity for recapitalizing the banking system and the shift of this burden on the shoulders of the taxpayer was essentially the last straw that led to the exclusion of the Cypriot state from the international markets. In 2012 the sale of short-term public debt securities in the local market was not enough to finance the budget deficit and the state had to resort to interstate borrowing. It borrowed 2.5 billion from Russia.
The major problems of the banking system rendered the need to find resources for their management imperative. The negotiations with troika led to a first memorandum, which included a series of austerity measures, very similar to those applied in Greece and other southern European countries as a prerequisite for a loan of 17.5 billion Euros.
However, while the Cypriot government began implementing the austerity measures, the EU refrained from formally adopting the memorandum before the presidential elections in Cyprus, which were held in February 2013. The EU preferred to renegotiate the memorandum again with the government of the Right, whose victory was expected. The new memorandum, which has been agreed and put in force since, is fundamentally different from all other memorandums that have been implemented in other countries of southern Europe.
The final memorandum[8] smashed the development model of the economy from one day to the next. The final memorandum differs from the first in several respects, but what makes it extremely groundbreaking, not only in relation to the first memorandum but also in relation to all others being implemented in other countries of southern Europe, is the fact that it destroyed confidence in the private banking system of Cyprus, confidence that cannot easily be regained: It provided for the ‘rescue’ of the banking system through the ‘method ‘ of bail-in, i.e. with funds from shareholders, creditors and depositors of banks, and not through external recapitalization (bail-out).
The bail-in of the banks aimed at reducing the bail-out amount needed for the Cypriot economy from 17.5 billion, provided in the first Memorandum, to 10 billion provided in the final own. Of course, these 10 billion of troika loan will be released if and when Cyprus implements the austerity measures agreed in a strict and timely manner: privatization of the profitable public companies and ports, wage and pension cuts in the public and private sector, reduction of public deficit through mainly the contraction of public spending and minimal increases in taxes related to capital and wealth, introduction of regulations providing for very flexible arrangements in the labour market, raising of retirement age, restructuring of the banking sector, etc.
The bank restructuring undertaken in Cyprus was certainly incompatible with the existing institutional framework of the EU: It required a strict control of capital flows both within Cyprus (transfer of funds from one bank to another for example) as well as abroad. In the case of Cyprus, however, the EU not only allowed for the control of capital movements but, by imposing an immediate contraction of the banking sector, forced the Cypriot authorities to adopt it.
3. Cyprus Economy and the management of the Troika.
Despite the extreme management measures imposed by the troika in the banking system in Cyprus, the crisis cannot be considered as ‘under control’. The deposits in the Cypriot banking system (including cooperatives) continued to decline in 2013, despite the strict restrictions on the outflow of deposits: Since the end of December 2012 until the end of December 2013, they decreased by 22.3% (Table 1, a reduction which of course includes the bail-in). Since then they are relatively stable.
But the most important problem is the large increase in non-performing loans, despite the fact that a significant number of loans was restructured (Table 2).
In November 2015, non-performing loans were 46% of total loans and 154% of GDP. Such a figure would be mathematically impossible in many European countries as their total private debt as a proportion of GDP is less than 154%.
The perpetuating crisis of the financial system is certainly not unrelated to the austerity policies and their aftermath: reduction of the primary deficit, great recession in 2013, reduction of wages in the public and private sectors and rising unemployment.
It is difficult to achieve reduction of public deficit through reductions in state expenditure, without great social costs at a time during which state expenditures (including interest) as a percentage of GDP were and still are significantly less than the average for the EA-12 (despite the fact that the interest on the public debt as a % of GDP of the latter is much lower than that of Cyprus, because of the lower debt rate). On the other hand, it is very difficult to imagine the current government increasing corporate tax. There is no doubt it will call upon the dependence of the economy on foreign companies. However, since consumer taxes have already been increased, it would be difficult for the government to turn to this direction without serious social consequences. With these data at hand we anticipate further reductions in salaries of state employees, who, moreover, have been the scapegoat of the dominant ideology during the last years. Such a development, however, would have a negative impact not only on the growth rate of the economy, but also in non-performing loans.
| Date | Domestic residents | Other euro area residents | Rest of World residents | Total | Annual Growth Rates of Total |
| Dec. 2007 | 32.294,2 | 1.390,4 | 18.829,4 | 52.514,0 | 26,2 |
| Dec. 2008 | 39.461,8 | 1.090,6 | 15.456,8 | 56.009,3 | 6,4 |
| Dec. 2009 | 41.011,6 | 1.290,7 | 15.852,7 | 58.009,3 | 4,4 |
| Dec. 2010 | 45.379,3 | 4.035,3 | 20.525,2 | 69.939,7 | 18,2 |
| Dec. 2011 | 43.746,9 | 5.355,4 | 20.194,2 | 69.297,6 | -2,2 |
| Dec. 2012 | 43.316,8 | 3.887,6 | 21.518,0 | 70.157,4 | 1,7 |
| Dec. 2013 | 32.743,0 | 2.253,1 | 11.767,4 | 47.004,2 | -22,3 |
| Dec. 2014 | 32.282,6 | 1.957,8 | 11.884,0 | 46.124,4 | -1,9 |
| Dec. 2015 | 32.882,4 | 2.731,2 | 10.354,7 | 45.968,3 | -0,3
|
Table 1: Deposits (in million) in Cypriot banks and Cooperative Institutions
Source: Central Bank of Cyprus
| Date | Total Facilities | NPL | NPL (% of Total facilities | GDP (End of respective Year) | NPL (% of GDP) | |
| 30/6/2013 | 68.627.300 | 24.105.915 | 30,59 | 18.064.620 | 133,44 | |
| 30/9/2013 | 64.713.867 | 26.006.059 | 37,25 | |||
| 31/12/2013 | 62.725.662 | 26.848.178 | 41,46 | 18.064.620 | 148,62 | |
| 31/3/2014 | 61.241.284 | 27.672.232 | 43,84 | |||
| 30/6/2014 | 59.638.432 | 28.098.255 | 46,40 | |||
| 30/9/2014 | 57.970.405 | 28.228.436 | 48,47 | |||
| 30/11/2014 | 56.809.089 | 27.802.434 | 49,69 | 17.393.680 | 159,84 | |
| 31/1/2015 | 60.387.565 | 27.803.371 | 46,04 | |||
| 30/4/2015 | 59.284.565 | 27.754.302 | 46,81 | |||
| 31/7/2015 | 57.784.473 | 27.390.896 | 47,40 | |||
| 31/10/2015 | 57.116.396 | 27.428.600 | 48,20 | |||
| 30/11/2015 | 59.469.480 | 27.388.602 | 46,05 | 17.781.040 | 154,03 | |
Table 2: Non-Performing Loans (in million, local operations) in Cypriot banks and Cooperative Institutions
Unemployment rate in Cyprus has been over time much lower than in the EA-12. But it has been increasing rapidly in recent years. From 3.8% at the beginning of the global crisis in 2008 increased to 15.6 % in 2015[9], while youth unemployment has already reached 40%[10] in 2014.
While wages are drastically reduced during the last years, this is not the case with corporate profits. The cost of the crisis is mainly paid by wage labour since, all these years the crisis lasts, the ration Property Revenue/Labour Revenue depicts a significant increase, as shown in Chart 8.
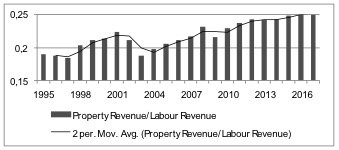
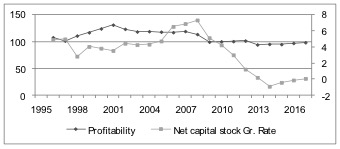
The ration Property Revenue/labour Revenue, which has been rising steadily since 2009, in 2015 reached its highest point since 1995. It is for this reason that the rate of profit on fixed capital is relatively stable since 2009 (Chart 9).
Retaining the rate of profit at high levels is not conducive to economic growth, because the decline in unit labour cost does not lead to a corresponding decline in commodity prices, but mainly to increase in the rate of exploitation of labour power. The international competitiveness of Cypriot products does not increase and therefore a potential growth through exports is not in sight.
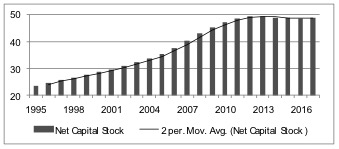
The prolonged downturn of the economy, combined with the absence of a medium-term state policy for restructuring the production capacity of the country, reduce investment opportunities that promise high profit rate. The result of this situation is the growing deviation between the rate of accumulation of fixed capital and the profit rate (Chart 9), and the reduction in the volume of fixed capital since 2013 (Chart 10).
Conclusions
- The Cyprus crisis manifested its self asa crisis of thefinancial sector, which developed out of proportions and createdafinancialThelinkof the Cypruspoundto the euro andtheadoption of the euro in 2008aredirectly related totheinflatedfinancial sectorandthe creationof the bubble.
- The Cyprus crisis can be regarded as a product of the crisis in the euro area that was introduced in Cyprus mainly through the prolonged recession in Greece.
- The management of the Crisis in 2013 by the Cypriot government and the troika has not as yet resolved the crisis of the banking system, but has plunged the country into recession. This creates a vicious circle, where the crisis in the financial sector fuels the recession in real economy, and vice versa.
- The inflexibility of the rate of profit does not allow the increase of price competitiveness for Cypriot products. Social gains are sacrificed, for the moment at least, on the altar of profit and not competitiveness[11].
- Under these circumstances it is difficult to argue that a new bail-out of the banking system through public money will not be necessary. There is a strong possibility that public debt will follow a course opposite to the optimistic previsions of the European Commission.
Bibliography
Central Bank of Cyprus, Annual Report 2012, Nicosia, 2013
European Economy, Statistical Annex, Autumn 2015, http://ec.europa.eu/economy_finance/publications/eeip/2015-sa-autumn_en.htm
Husson Michel, « Économie politique du système euro », in Social Studies. Annual trilingual Social Research Review, No. 2-3, Ed. Alexandria, Athens, 2013
IMF, Country Report, no 14/92, on Cyprus, April 2014, (http://www.imf.org/external/pubs/ft/scr/2014/cr1492.pdf).
Memorandum of Understanding on Specific Economic Policy Conditionality, http://www.mof.gov.cy/mof/mof.nsf/final%20MOUf.pdf
Report on the Economy and Employment 2012, INEK-PEO, Nicosia, 2012
Report on the Economy and Employment 2013, INEK-PEO, Nicosia, 2013
Stephanou Constantinos, ‘Big Banks in Small Countries: The case of Cyprus’, Cyprus economic Policy Review, Vol. 5, No 1, 2011.
Tombazos Stavros, ‘Centrifugal Tendencies in the Euro Area’, Journal of Contemporary European Studies, 19: 1, 33 — 46, 2011
Stavros Tombazos, Associate Professor, Department of Social and Political Sciences, University of Cyprus
tombazos@ucy.ac.cy
[1] For a detailed analysis of the Current Account and the reasons for the significant deviation of the trade balance, see Central Bank of Cyprus, Annual Report 2012, Nicosia, 2013.
[2] See Husson Michel, « Économie politique du système euro », in Social Studies. Annual trilingual Social Research Review, No. 2-3, Ed. Alexandria, Athens, 2013
[3] See Report on the Economy and Employment 2012, INEK-PEO, Nicosia,2012
[4] See Tombazos Stavros, ‘Centrifugal Tendencies in the Euro Area’, Journal of Contemporary European Studies, 19: 1, 33 — 46, 2011
[5] Report on the Economy and Employment 2012, op. cit.
[6] See Stephanou Constantinos, ‘Big Banks in Small Countries: The case of Cyprus’, Cyprus economic Policy Review, Vol. 5, No 1, 2011.
[7] See Report on the Economy and Employment 2012, op. cit.
[8] See Memorandum of Understanding on Specific Economic Policy Conditionality, http://www.mof.gov.cy/mof/mof.nsf/final%20MOUf.pdf
[9] European Economy, Statistical Annex, Autumn 2015, http://ec.europa.eu/economy_finance/publications/eeip/2015-sa-autumn_en.htm
[10] IMF, Country Report, no 14/92, on Cyprus, April 2014, (http://www.imf.org/external/pubs/ft/scr/2014/cr1492.pdf).
[11] See also Report on the Economy and Employment 2013, INEK-PEO, Nicosia, 2013


