29 October 2025
We are hurtling toward climate chaos. The planet’s vital signs are flashing red. The consequences of human-driven alterations of the climate are no longer future threats but are here now. This unfolding emergency stems from failed foresight, political inaction, unsustainable economic systems, and misinformation. Almost every corner of the biosphere is reeling from intensifying heat, storms, floods, droughts, or fires. The window to prevent the worst outcomes is rapidly closing. In early 2025, the World Meteorological Organization reported that 2024 was the hottest year on record (WMO 2025a). This was likely hotter than the peak of the last interglacial, roughly 125,000 years ago (Gulev et al. 2021, Kaufman and McKay 2022). Rising levels of greenhouse gases remain the driving force behind this escalation. These recent developments emphasize the extreme insufficiency of global efforts to reduce greenhouse gas emissions and mark the beginning of a grim new chapter for life on Earth.
In this report, we seek to speak candidly to fellow scientists, policymakers, and humanity at large. Given our roles in research and higher education, we share an ethical responsibility to sound the alarm about escalating global risks and to take collective action in confronting them with clarity and resolve. We show evidence of accelerated warming and document changes in Earth’s vital signs. These indicators build on the framework introduced by Ripple and colleagues (2020), who issued a declaration of a climate emergency that has garnered support from approximately 15,800 scientist signatories worldwide. We also examine recent extreme weather disasters and discuss physical and social risks. The final sections of the report include suggested climate mitigation strategies and the broader societal transformations needed to secure a livable future. A summary of key findings is given in box 1.
Box 1.
- •The year 2024 set a new mean global surface temperature record, signaling an escalation of climate upheaval.
- •Currently, 22 of 34 planetary vital signs are at record levels.
- •Warming may be accelerating, likely driven by reduced aerosol cooling, strong cloud feedbacks, and a darkening planet.
- •The human enterprise is driving ecological overshoot. Population, livestock, meat consumption, and gross domestic product are all at record highs, with an additional approximately 1.3 million humans and 0.5 million ruminants added weekly.
- •In 2024, fossil fuel energy consumption hit a record high, with coal, oil, and gas all at peak levels. Combined solar and wind consumption also set a new record but was 31 times lower than fossil fuel energy consumption.
- •So far, in 2025, atmospheric carbon dioxide is at a record level, likely worsened by a sudden drop in land carbon uptake partly due to El Niño and intense forest fires.
- •Global fire-related tree cover loss reached an all-time high, with fires in tropical primary forest up 370% over 2023, fueling rising emissions and biodiversity loss.
- •Ocean heat content reached a record high, contributing to the largest coral bleaching event ever recorded, affecting 84% of reef area.
- •So far, in 2025, Greenland and Antarctic ice mass are at record lows. The Greenland and West Antarctic ice sheets may be passing tipping points, potentially committing the planet to meters of sea-level rise.
- •Deadly and costly disasters surged, with Texas flooding killing at least 135 people, the California wildfires alone exceeding US$250 billion in damages, and climate-linked disasters since 2000 globally reaching more than US$18 trillion.
- •Climate change is endangering thousands of wild animal species; more than 3500 species are now at risk and there is new evidence of climate-related animal population collapses.
- •The Atlantic meridional overturning circulation is weakening, threatening major climate disruptions.
- •Climate change is already affecting water quality and availability, undermining agricultural productivity, sustainable water management, and increasing the risk of water-related conflict.
- •A dangerous hothouse Earth trajectory may now be more likely due to accelerated warming, self-reinforcing feedbacks, and tipping points.
- •Climate change mitigation strategies are available, cost effective, and urgently needed. From forest protection and renewables to plant-rich diets, we can still limit warming if we act boldly and quickly.
- •Social tipping points can drive rapid change. Even small, sustained nonviolent movements can shift public norms and policy, highlighting a vital path forward amid political gridlock and ecological crisis.
- •There is a need for systems change that links individual technical approaches with broader societal transformation, governance, policies, and social movements.
Vital signs
The last few years have seen surface temperature, ocean temperature, and sea ice extent records broken by extraordinary margins (supplemental figure S1). This is consistent with warming accelerating because of a large cloud feedback and decreasing emissions of aerosols that mask warming (Hansen et al. 2025, Tselioudis et al. 2025). The rapid pace of warming may also be partly because of a weakening land carbon sink. In 2023, land uptake of carbon dioxide dropped sharply from historical averages, likely driven by El Niño and intense forest fires (Friedlingstein et al. 2024). As a result, atmospheric carbon dioxide concentrations rose unusually quickly, despite only modest increases in fossil fuel emissions. Of the 34 planetary vital signs we continue to track (figures 1 and 2), 22 are at record levels (supplemental table S1), and many show alarming trends that we highlight below. Sources and additional details about each variable are provided in supplemental file S1. For vital signs measured with subannual frequency, ranks, and other statistics are based on year-to-date averages (table S1).
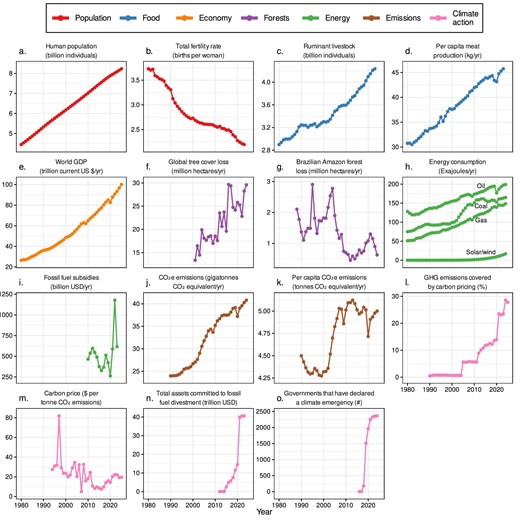
Time series of climate-related human activities. In panel (f), tree cover loss does not account for forest gain and includes loss due to any cause. For panel (h), statistics are based on total energy supply (Energy Institute 2025); hydroelectricity and nuclear energy are shown in supplemental figure S2. Sources and additional details about each variable are provided in supplemental file S1.
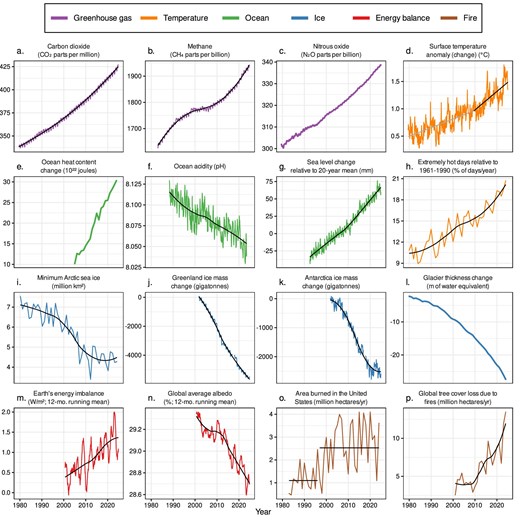
Time series of climate-related responses. For surface temperature anomaly (d), estimates based on a segmented linear regression model are shown in gray (prior to 2010) and black (beginning in 2010). For area burned (o), the black horizontal lines show changepoint model estimates, which indicate abrupt shifts (supplemental figure S3). For other variables with relatively high variability, local regression trendlines are shown in black. The variables were measured at various frequencies (e.g., annual, monthly, weekly). The labels on the x-axis correspond to midpoints of years. Sources and additional details about each variable are provided in supplemental file S1.
The human enterprise
Global human population size is at a record high in 2025 (figure 1a). Similarly, ruminant livestock and per capita meat consumption are at all-time highs, as of 2023 (figure 1c, 1d). Ruminant livestock methane emissions account for roughly half of all agricultural greenhouse gas emissions (FAO 2023). Human and ruminant population sizes are increasing by approximately 1.3 million and 0.5 million individuals per week, respectively (figure 1a, 1c). Global gross domestic product reached an all-time high in 2025, on the basis of preliminary data, with the world economy expanding by approximately 3.5% over the previous year (figure 1e). Although this growth is often celebrated as a sign of progress, continued economic expansion remains largely coupled with increased resource consumption, ecological degradation, and increased greenhouse gas emissions (Wiedmann et al. 2020). Two-thirds of warming since 1990 has been attributable to the wealthiest 10% because of high-consumption lifestyles, high per capita fossil fuel use, and investments (Schöngart et al. 2025). Taken together, these trends suggest humanity is in a state of ecological overshoot—a state in which resources are consumed faster than they can be replenished (Rees 2023). However, the overconsumption of critical resources and the consequences in terms of suffering are also unequally distributed across the globe. Seven of the eight globally quantified safe and just planetary boundaries have been transgressed, highlighting both overshoot and deepening justice concerns (Rockström et al. 2023). Reducing ecological overshoot would help mitigate socioenvironmental pressures, but would require both cutting emissions and rethinking the consumer society while transitioning to a sustainable economy within safe and just Earth system boundaries (Gupta et al. 2024, Ripple et al. 2024).
Energy
Total fossil fuel energy consumption reached a record high, rising by 1.5% in 2024 from 2023 (figure 1h). This was a result of coal, oil, and natural gas consumption each rising to a record high in 2024 (figure 1h). Solar and wind energy consumption together also reached a record high in 2024, rising 16.4%; however, fossil fuel energy consumption was roughly 31 times greater than solar and wind energy consumption (figure 1h).
As a result of surging fossil fuel consumption, energy-related emissions rose 1.3% in 2024, reaching an all-time high of 40.8 gigatons (Gt) of carbon dioxide equivalent (CO2eq; figure 1j). In 2024, the greatest fossil fuel greenhouse gas emitters were China (30.7% of total), the United States (12.5%), India (8.0%), the European Union (6.1%), and Russia (5.5%); together, they accounted for 62.8% of global emissions (supplemental table S3). Much of the rise in fossil fuel electricity generation may be due to hotter temperatures (Graham et al. 2025).
Forests and wildfires
Global tree cover loss was 29.6 megahectares (Mha) in 2024, the second highest area on record and a 4.7% increase relative to 2023 (figure 1f). This was partly due to fire-related global tree cover loss reaching a record high largely because of climate change and El Niño (figure 2p). The losses within tropical primary forest were particularly large in 2024, with fire-related losses reaching a record high of 3.2 Mha, compared with just 0.69 Mha in 2023—a 370% increase (supplemental figure S4). In addition to major impacts on biodiversity and ecosystem services, the loss of primary forest in 2024 alone resulted in roughly 3.1 Gt of CO2eq greenhouse gas emissions, which is approximately 8% of total 2024 anthropogenic emissions (WRI 2025). Massive wildfires have also been occurring in 2025. By August, the European Union’s wildfire season was already the most extensive on record in terms of area burned, exceeding 1 million hectares (Niranjan 2025). Canada’s wildfire season is currently the second largest on record by area burned (Bowden 2025), and climate change is likely a major contributing factor (Seydi et al. 2025). This exemplifies a dangerous climate feedback loop as fires release vast carbon emissions that accelerate global warming, which in turn fuels more fire activity. Wildfires also have more direct impacts, including significant smoke-related morbidity and mortality (Alari et al. 2025).
In contrast to the global trend, deforestation in Brazil’s Amazon rainforest dropped by roughly 30%, reaching its lowest level in 9 years, with 0.63 million hectares cleared by 31 July 2024 compared with 0.90 million hectares by 31 July 2023 (figure 1g). These estimates are based on the Brazilian Amazon Rainforest Monitoring Program by Satellite methodology, which involves quantifying deforestation for areas exceeding 6.25 hectares in the Brazilian Legal Amazon using specialist photointerpretation of satellite imagery (de Almeida et al. 2021). The decline is attributed to strengthened environmental enforcement under President Luiz Inácio Lula da Silva’s administration, which has prioritized conservation efforts (Vilani et al. 2023). However, despite the reduction in deforestation in the Brazilian Amazon, the region experienced a significant surge in fires because of severe drought conditions (Butler 2024). These fires, which are not always classified as deforestation, have raised concerns about ongoing ecosystem degradation and the challenges of accurately monitoring forest health. The Amazon continues to face threats from climate change and human activities, which underscores the need for sustained conservation efforts to increase its resilience (Schaeffer et al. 2025). By 2050, as much as 47% of the Amazon rainforest could face compounding disturbances, potentially leading to irreversible ecosystem transitions (Flores et al. 2024).
Global greenhouse gases and temperature
On the basis of year-to-date averages, atmospheric concentrations of carbon dioxide, methane, and nitrous oxide were all at record high levels again in 2025 (figure 2a–2c). In addition, in May 2025, the average carbon dioxide concentration at the Mauna Loa Observatory, in Hawaii, exceeded 430 parts per million—a level likely not seen in millions of years (Judd et al. 2024). So far, in 2025, global average surface temperature is at the second highest level on record (figure 2d, table S1), and the incidence of extreme heat based on the proportion of days where the maximum temperature exceeds the 90th percentile for the baseline period 1961–1990 reached a record high in 2024 (figure 2h). The past 10 years, 2015–2024, are the 10 warmest years on record (WMO 2025b).
Energy balance
An important predictor of future warming is Earth’s energy imbalance—the difference between the amount of solar energy absorbed and the amount radiated back into space (figure 2m). It is rising much more quickly than predicted by most climate models, possibly because of a darker planet corresponding to a large decrease in Earth’s albedo (reflectivity; Goessling et al. 2025, Mauritsen et al. 2025), which is near an all-time low (figure 2n). Most of the recent decrease in albedo is, in turn, caused by an exceptionally strong cloud feedback (Hansen et al. 2025). Cloud characteristics are changing because of both rising temperatures and declining emissions of aerosols such as sulfur dioxide, which affect cloud brightness and formation (Hausfather 2025). Together, these factors may have contributed greatly to the recent acceleration in warming (figure 2d).
Oceans and ice
In 2025, on the basis of year-to-date averages, Greenland’s and Antarctica’s ice mass levels were at record lows (figure 2j, 2k). Recent research shows that the Greenland and West Antarctic ice sheets may have already passed critical tipping points because of current global warming levels (Stokes et al. 2025). Greenland is rapidly losing ice from surface melt and runoff, whereas West Antarctica faces a growing risk of irreversible collapse from ocean-driven melting beneath its ice shelves. With ice loss rates having quadrupled since the 1990s, these changes are likely to commit the planet to several meters of sea-level rise, even without additional emissions (Stokes et al. 2025). The current warming appears sufficient to trigger this long-term increase in the loss of ice. The rate of sea-level rise has doubled in the last three decades (figure 2g; also see Hamlington et al. 2024).
Another notable development is that ocean heat content reached a record high (figure 2e). This likely contributed to the ongoing coral bleaching event, affecting roughly 84% of the world’s coral reef area between 1 January 2023 and 31 May 2025, making it the most extensive bleaching incident in recorded history (NOAA Coral Reef Watch 2025). Furthermore, ocean pH reached a record low, indicating the highest acidity on record (figure 2f) and new evidence suggests the global planetary boundary for ocean acidification may have been crossed in 2020 (Findlay et al. 2025). Ocean acidification poses a serious threat to marine calcifiers, including some corals and phytoplankton—the base of ocean food webs (Findlay et al. 2025).
Continue reading at academic.oup.com
We remind our readers that publication of articles on our site does not mean that we agree with what is written. Our policy is to publish anything which we consider of interest, so as to assist our readers in forming their opinions. Sometimes we even publish articles with which we totally disagree, since we believe it is important for our readers to be informed on as wide a spectrum of views as possible.


")